
When CFOs are deciding between multiple hedging strategies (e.g. single option, collars, par forwards, condors, etc.) It can seem very difficult and a bit of a shot in the dark. Often, banks and other providers offer a word description, or a simplistic graphic illustrating the payoff at different terminal spot values. However, the key issue - the likelihood of each outcome (and the resulting expected value) is not represented in any meaningful way.
Understanding the distribution of outcomes is key to evaluating the true efficacy of a hedging strategy and ultimately allowing any CFO to make an informed decision. This is only obtained through robust Monte Carlo (MC) simulations. An MC simulation estimates future market moves (over many thousands of possibilities) and tabulates the results of each option or other hedge strategies accordingly. The sum of outcomes allows the calculation of the expected value of the strategy, allowing it to be compared with others. Fig 1 shows an example of the first 30 paths over a 7 month simulation period of EURUSD.

Methodology
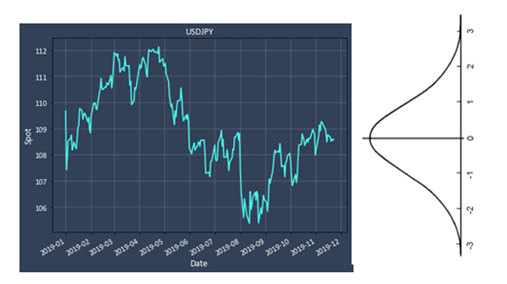
How are these paths determined? Often, markets are simulated by making some simplifying assumptions; the most common that it follows a normal distribution (the “bell curve”, see fig 2). That is to say, spot rates tend to make more small moves (closer to the present value), and fewer moves that are farther away (within any given period). It's symmetric about a mean (current spot), and the width of the normal is proportional to its standard deviation (ie the volatility). Implementation of this is often called geometric Brownian motion[1].
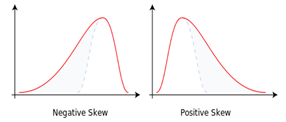
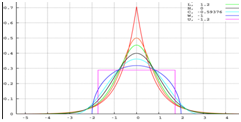
However, markets are often not so well behaved! They may be skewed to one side or another (fig 3), or they may have "fat tails" (fig 4). The ability to adapt the simulation to more closely mimic market conditions will result in a more useful simulation. For example, if you expected a general long term trend, you might skew the distribution to one side. If you expect a period of higher volatility but were unsure of the general direction (say post-election), you might select fatter tails.
Adding skew or fat tails still hold volatility constant - a simplifying assumption that can be unrealistic. So we have gone a bit further and added stochastic volatility and jump-diffusion models.
Representing the results of 10,000 simulations in a meaningful way which enhances decision-making is very important. It's simply not possible to represent 10,000 results in a simple option payoff line graph (such as is often shared by banks and other providers). One method which we have found to be very useful is side-by-side box plots.
A box plot represents the characteristics of a distribution. The central green line represents the median of all results. The bottom and top of the box represent the first and third quartiles; therefore 50% of all results are within the box. Finally, the "whiskers" represent the furthest extent of the results - the "outliers".
Fig 5 shows the output- a comparison of four EURUSD hedge strategies (forward, call, participating forward and collar), as well as the unhedged exposure of 10M EUR, short the spot (i.e. client protects against rising spot). A geometric Brownian motion distribution was used, and 10,000 paths were simulated. Vertical scale P&L is in USD.

Note how easy it is to compare the downside risk limitation for each strategy as compared to the unhedged exposure, and the amount of potential upside as well. For example, the par forward median is much less negative than the outright call, but the upside is much lower as well. This particular collar offers not much benefit over the forward.
When comparing multiple hedging strategies, it is insufficient for CFOs to look at simple payoff diagrams, as they do not indicate the likelihood of any particular terminal spot and value. Using Monte Carlo simulations is a far more insightful and useful methodology. It is possible to go beyond simple normal distributions and add skew, fat tails, or even stochastic volatility to stress the hedge strategies in a way that more closely approximates expected market behavior. Finally, using box plots (or violin plots) to visually compare the unhedged distribution and hedge strategies allows a very intuitive understanding of the efficacy of each.
[1] Creating true random distributions is a science all in itself. Our methods include generating antithetic and moment matching to ensure the first and second moments are exact.
If you would like to discuss how Deaglo's services could help your firm manage its risk and what to request a free Transaction Cost Analysis. Please reach out to our team and book a consultation below.